The enrolment numbers used in the school district’s facilities review, which includes the possibility of closing Kwalikum Secondary School, are a hot topic of discussion.
The review, done by Matrix Planning Associates for School District 69 (Qualicum), says declining enrolment and the resulting loss in funding will make it difficult to keep two high schools open and recommends closing KSS.
A public meeting was hosted “by and for concerned citizens” at the Qualicum Beach Civic Centre Monday night with presentations on the numbers and reasons to keep KSS open.
Concerned parent Warren Munroe, who has a Master of Arts in Geography specializing in human settlement patterns, migration, statistics and geographic information systems, gave a presentation on population change and repeated the point he has brought up at several public meetings, that a graph used by Matrix to show the declining enrolment is misleading.
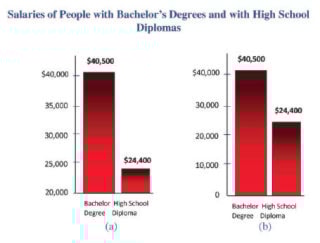
Vancouver Island University mathematics professor Eric Agyekum told The News he agrees that while graphs can be used many different ways, and can be misleading, there is nothing wrong with those uses as long as the details are clear.
He said it’s not that common to see completely inaccurate graphs or graphs obviously being misused but it does happen, sometimes unintentionally.
“Neither is wrong,” he said showing examples of complete graphs in context and ones that focus on a specific portion.
“It’s okay to focus on one part if you want more detail, but it’s important to look at where the numbers start,” he said indicating it is both the publisher’s responsibility to include the details and the viewer’s responsibility to look carefully.
“You give the range, which can be expressed in different ways such as the confidence interval — how confident the statisticians are, such as correct within +/- 5%. in demographics we use cohort analysis — giving the high and low based on different parameters such as the lowest or highest birth rate.”
Munroe explained the difficulties and details of working with statistics and cautioned he was not just looking for a way to keep the school open, he was looking to find the best information and analysis possible and that might lead to the conclusion that closing the school is the best option.
He said they have been looking at all sorts of ways of gathering enrolment information, including counting year book pictures.
He showed the Matrix graph with enrolment dropping from near 5,000 in 2004 to 4,400 in 2009 and projected to keep dropping to a highlighted “low point” under 4,000 around 2016 before rebounding.
He pointed out the graph only started in 2004 and showed the number of students starting at 3,800, leaving out the proper context.
He put up another graph that went back to 1983 and included all the students from zero making the graph look flatter and highlighting the fact that the district had fewer students in the mid 1980s.
“I was curious to see, and indeed there was a lower point of enrolment,” he said.
He added that the Matrix graph only had projected 2010 numbers available at the time and the actual enrolment was about 100 students higher than the projection — suggesting they were using the lowest case estimates rather than the middle or high, and it was misleading to not point out which they were using.
He said the new Statistics Canada census data is due this year and he hopes any decisions will be based on the latest and most accurate demographic information.
He said the funding formula change in 2001 to a per pupil model penalizes schools that expanded capacity, as KSS did in the last decade.
“If KSS hadn’t expanded, it wouldn’t be facing closure,” he said.
Agyekum shared Munroe’s appraisal of Statistics Canada as a great organization and the place you want to get your numbers from.